
Network automation has typically lagged behind in data management innovations.
We’ve wrestled with spreadsheets, fought with source of truth tools, cursed CMDBs, and banged our heads against 5,000-line JSON files.
Yet the answer to our data woes has been hiding in plain sight the whole time. All we needed to do was look at other industries to find interesting and workable data management techniques that are easily applied to networking.
For more than a decade, industries as varied as retail, pharmaceuticals, and financial services, have been using a powerful data model called a knowledge graph to work with densely interconnected data.
For the last 8 years, I’ve been championing the idea of a knowledge graph for infrastructure data as well. Early on, reactions to my message were mostly confusion: “Do you mean a source of truth?”
But the times they are a-changin’, as Bob Dylan famously said. Every day I hear more and more practitioners and vendors in infrastructure management talk about knowledge graphs.
This shift is extremely encouraging to see because I’m as convinced as ever that a knowledge graph is the only way to effectively manage infrastructure data and automation.
To understand knowledge graphs, it also helps to understand a handful of closely related but distinct ideas such as schema, ontology, and semantics, as well as the differences between graph databases and relational databases.
In this post, I’ll walk through the definitions of each of those key concepts, show you how they interact and relate to each other, and why, when they come together, they’re so powerful for managing infrastructure data.
What is a knowledge graph?
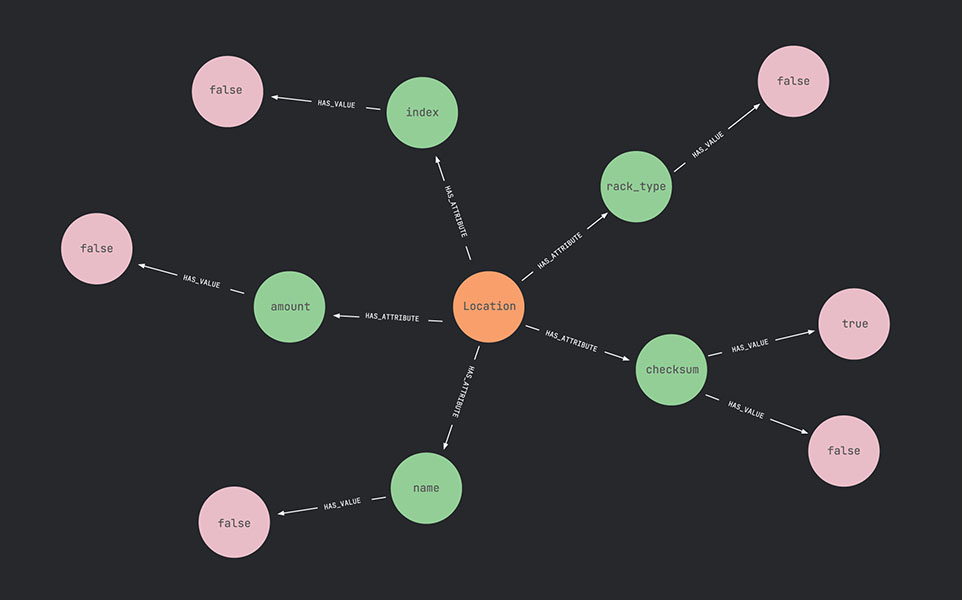
A knowledge graph is a data model that represents entities and the relationships between them as nodes and edges.
Each node represents a thing—like a router, service, or VLAN—and each edge represents how those things connect. But the real power comes from the fact that those relationships carry meaning.
In other words, a knowledge graph doesn’t just record that two objects are linked. It encodes why they are linked and how that link matters. This makes it a foundation for reasoning, inference, and automation.
A related idea is the temporal graph, which adds time as a dimension. This lets you see not only how your infrastructure is connected, but how it was connected last week or last year. It’s critical for auditing, change analysis, and version control.
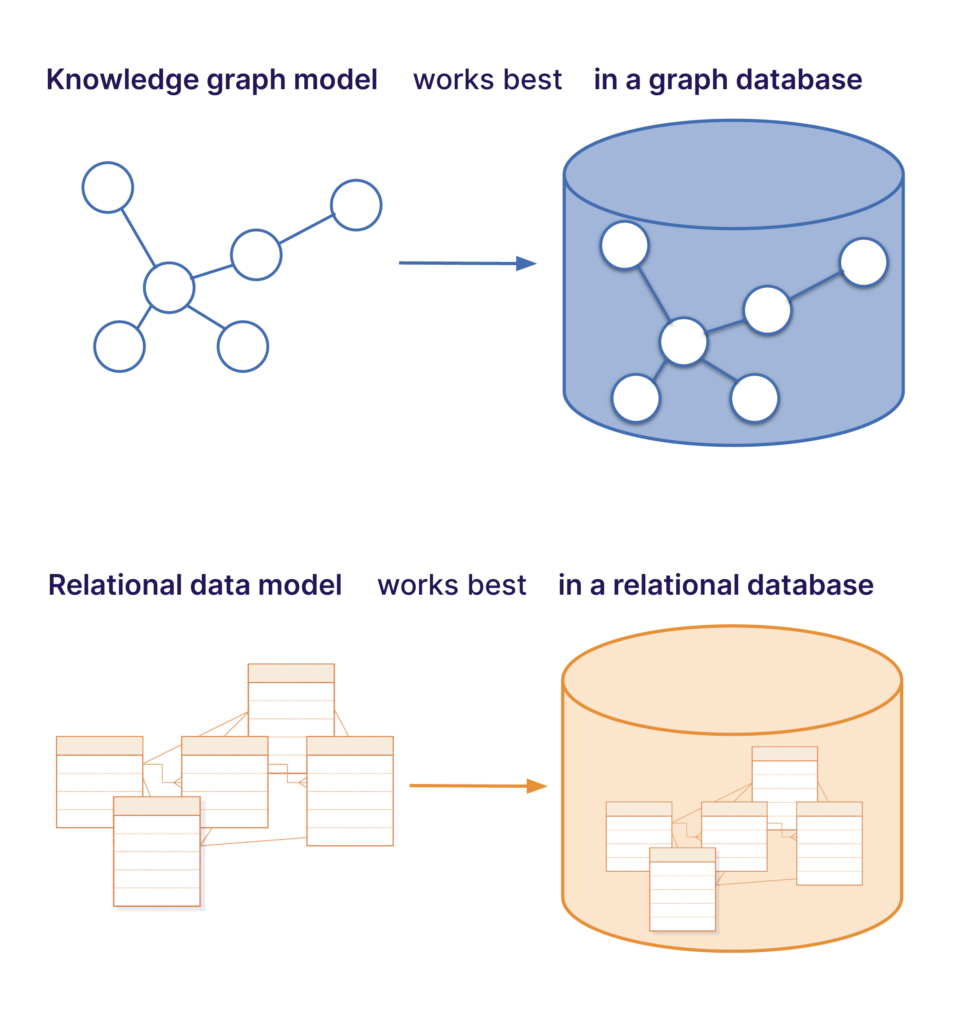
The traditional alternative to a knowledge graph data model is the relational data model. A relational data model, just like the relational databases that carry its name, represents data in tables and rows instead of nodes and edges.
What is a graph database?
Even though the terms knowledge graph and graph database both contain the word graph, they are not interchangeable terms.
A knowledge graph is a data model. A graph database is a storage and query engine.
A graph database stores the nodes and edges of a knowledge graph natively, making relationships first-class citizens. That means navigating connections is simple, fast, and scalable, whether it’s five devices or five million. And adding a new node type or relationship doesn’t require restructuring any existing data.
If you’ve seen me demo the behind-the-scenes database in Infrahub, you’ve seen this in action. When I open a topology view and query all the relationships from a single object, I’m not pulling from a table join. I’m navigating a living model that understands the data’s intent.
This is a big leap from relational databases, where data is stored in rows and columns, and relationships have to be constructed by adding fields to each table to connect them.
To be clear, it’s entirely possible to store a knowledge graph data model in a relational database but it will be prone to clunkiness because of the table-based storage. A graph database, in contrast, is specifically suited to storing knowledge graphs.
For infrastructure data, that matters. Networks are inherently relational: devices connect to interfaces, interfaces belong to systems, systems serve applications, and those applications depend on business logic. Graph databases map that reality natively.
What is a schema?
A schema is the blueprint for how data is organized and described within a system. It defines the types of entities that exist, their properties, and how they relate to each other.
In a relational database, the schema will specify things like tables, columns, and data types. In a graph database, the schema defines node types, relationships, and the attributes they can hold.
One of the reasons graph databases are so flexible is that the schema can evolve naturally over time. You don’t need to predefine every possible field or table. You can start simply and add new node types or relationships as your understanding of the domain grows.
What is ontology?
Ontology defines and categorizes the things in a system so both people and machines can understand their relationships.
While the schema defines how data is organized, the ontology goes further by defining what those entities mean and how they should relate. It describes the categories of things that exist in a system and the logic that connects them.
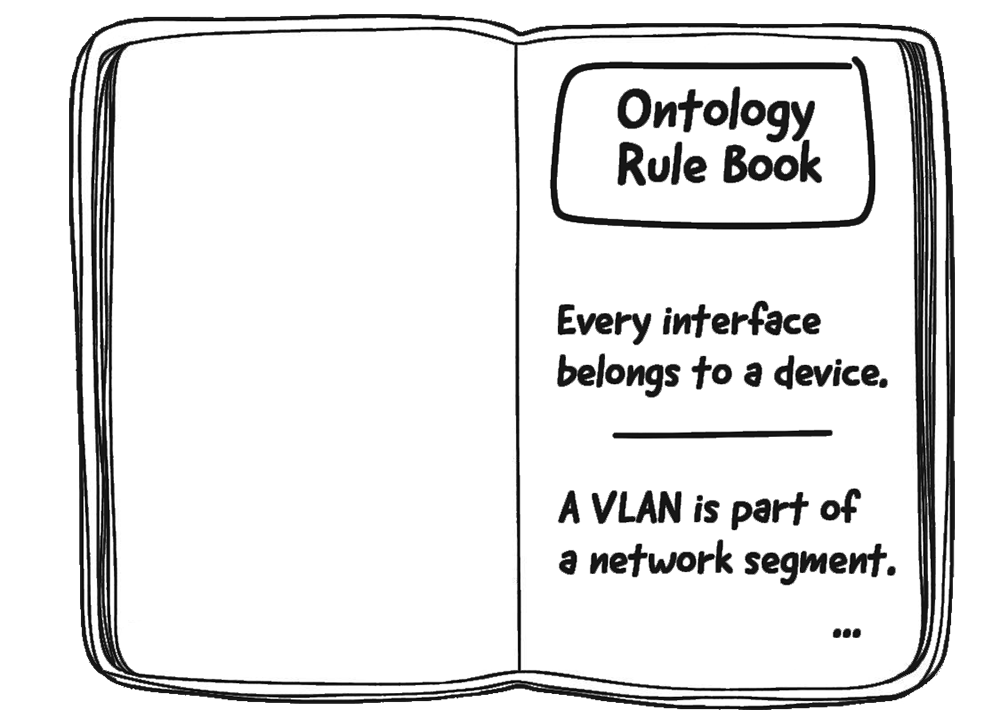
For example, in an infrastructure ontology, you might define that “every interface belongs to a device” or “a VLAN is part of a network segment.”
And now you might realize that ontology is another word for what we in infrastructure automation call business logic.
What is semantics?
Semantics is the layer that tells the system what relationships mean once they’ve been defined by the ontology.
If the ontology sets the rules for what types of entities and connections can exist, semantics defines how to interpret those connections in context. Put another way, ontology is the rulebook, semantics is the understanding.
Where ontology might define that a device can connect to a service, semantics tell you that a device powering a service implies dependency, or that one interface backing up another represents redundancy.

This interpretive layer is what allows the system (and by extension, AI or automation engines) to reason about cause and effect. It’s how the graph knows that if Device A powers Service B, then taking A offline would impact B.
Semantics turn the graph from a structure into logic. It can infer new relationships, detect anomalies, and simulate change impacts. Without semantics, you have connections. With semantics, you have understanding.
Anatomy of a knowledge graph
Here’s how these related data concepts come together in practice.
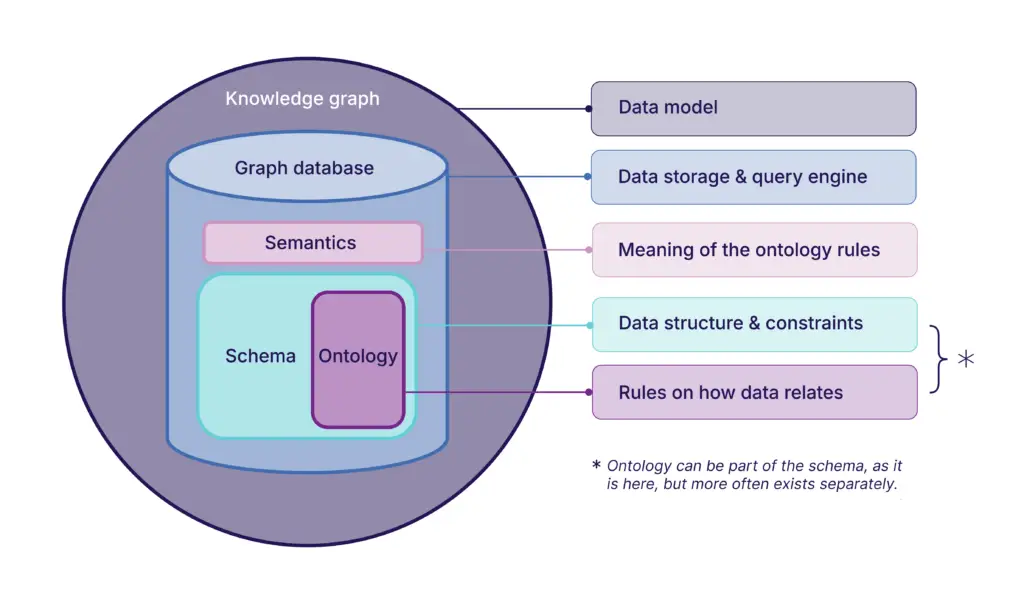
The knowledge graph is the outermost concept. It’s the data model that frames everything. The graph database is the storage and query engine that makes the model practical to work with.
Inside the database are the components that define, constrain, and bring meaning to the data. The schema defines the data structure, the ontology specifies the rules for how data relates, and semantics layer on to define what those relationships mean.
One important nuance: the ontology doesn’t have to live inside the schema, the way we’ve shown it in the diagram. In fact, in most systems, it doesn’t.
When schema and ontology are separate, we call that a general-purpose schema. The schema handles structure, constraints, and object-level integrity but no more. The ontology or business logic is embedded in application code, where it’s implicit and invisible. This makes the ontology difficult for anyone else to read or reason about.
A domain-specific schema pulls the ontology into the schema itself, making the business logic explicit and accessible for adding further validation to the data.
Infrahub uses a domain-specific schema. When you define your schema in Infrahub, you’re also defining your ontology.
The knowledge graph advantage for infrastructure
For most of the automation industry’s history, infrastructure data has lived in silos—one tool for IP address management, another for cable management, another for device inventory. Reconciling those datasets is a constant exercise in frustration, and any question that crosses system boundaries is nearly impossible to answer reliably.
Solving that problem starts with bringing all the data into one place. But infrastructure data sets are huge. They’re also interconnected in complex ways.
A relational model built on rows and columns will struggle to represent that web of relationships effectively, especially at scale.
The knowledge graph’s node/edge structure, however, is purpose-built for capturing entities and the relationships between them, without losing relationships, forcing data into shapes it doesn’t fit, or bogging down at scale.
For these reasons, a knowledge graph is really the only practical data model for representing infrastructure data.
Once you add a graph database to store the data, and a domain-specific schema to shape and validate the data, you now have something that has never existed before: a system that understands your infrastructure data from end to end.
Knowledge graphs are AI-ready
This combination is also, it turns out, exactly what AI needs to succeed.
AI agents are only as useful as the data they can access and reason about. Give an AI agent a collection of spreadsheets or a web of disconnected tools, and it will struggle to answer questions that cross boundaries because the connections simply aren’t there to follow.
A knowledge graph changes that. Because the data lives in a single model, and relationships are explicit and meaningful, an AI agent can traverse them to understand context, trace dependencies, and reason about impact. The graph database makes that traversal fast and reliable at scale. And a domain-specific schema ensures the AI is reasoning about accurate, consistent data.
This is why knowledge graphs have become the data model of choice to enable AI across industries, and why building your infrastructure automation on a graph puts you one step ahead.
Explore the knowledge graph of your infrastructure
Other industries learned the power of knowledge graphs years ago. Now it’s time for infrastructure automation to reap those same benefits.
A knowledge graph alone is only the starting point. What makes it transformative for infrastructure is what you build on top of it: a graph database that stores and traverses relationships natively, and a domain-specific schema that encodes the rules of your domain explicitly.
That’s the combination Infrahub is built on. The result is an infrastructure platform that doesn’t just store your data but understands it. A platform that can tell you not only what your infrastructure looks like today, but how it’s connected, what depends on what, and what the downstream impact of any change will be.
If you’re ready to see what that looks like in practice, download the Infrahub Community edition from GitHub to start building your own infrastructure knowledge graph. Or contact our sales team to learn more.
