
A lot of infrastructure automation still depends on someone manually running a script or playbook. Event-driven automation (EDA) takes a different approach. Instead of waiting for an engineer to act, the system listens for events and responds automatically based on predefined rules.
In this blog post, we walk through a practical example of building event-driven automation using Infrahub and Ansible. As an example, we cover how to automatically shut down and re-enable router interfaces based on a change inside Infrahub.
Follow along with our event-driven automation example
We’ll start with a short introduction to Infrahub, looking at how Infrahub is used to model infrastructure data, track changes, and expose those changes as events.
Then we’ll review how Ansible pulls inventory directly from Infrahub, how Infrahub sends webhooks, and how Ansible Rulebook uses those events to trigger playbooks when specific changes occur.
The example we use stays small so it’s easy to follow, while still showing a pattern that can be extended to other automation tasks.
You can follow along with the video that walks through similar steps. It shows the workflow as it runs and can be helpful to watch alongside this post while going through the examples.
You can also clone the accompanying Git repository, which contains most of the code and files needed to follow along on your own.
By the end of this post, we’ll have built a simple workflow that ties Infrahub and Ansible together. This workflow will allow us to go into Infrahub, select a device and interface, change the interface status to enabled or disabled, and let Infrahub send a webhook to Ansible. Ansible will then apply the change on the device.
A quick note on playbooks and rulebooks
There are two key pieces of EDA terminology to understand:
- Playbooks define what to do. Example: Shut down an interface.
- Rulebooks define when to do it. Example: When an event payload says
admin_status_change.
A rulebook listens for incoming events (usually webhook posts) and launches the right playbook when its condition matches.
When a post arrives with the right token and payload, the playbook runs automatically. The pairing of rulebook and playbook is the foundation of event-driven automation.
Getting Infrahub ready
Infrahub is a platform for modelling infrastructure data and using that data to drive automation. One of its key strengths is the flexible schema. We can define our own data structures instead of being locked into a fixed model. That makes it easier to represent how our environment actually works, whether that is devices, interfaces, sites, or relationships between them.
We’ve already covered the basics of installation in other posts, so this is just a quick overview of what’s involved. The general flow is to clone the Infrahub repository, install the dependencies using uv, and then use invoke to start the demo environment. The invoke commands wrap docker compose and bring up the required containers, loading a demo schema, and populating the system with sample data.
Git clone https://github.com/opsmill/infrahub.git

uv sync --all-groups

export INFRAHUB_API_TOKEN="06438eb2-8019-4776-878c-0941b1f1d1ec"


uv run invoke demo.start

uv run invoke demo.load-infra-schema

uv run invoke demo.load-infra-data
Once that’s done, you should be able to see the demo schema and sample data inside your Infrahub instance.
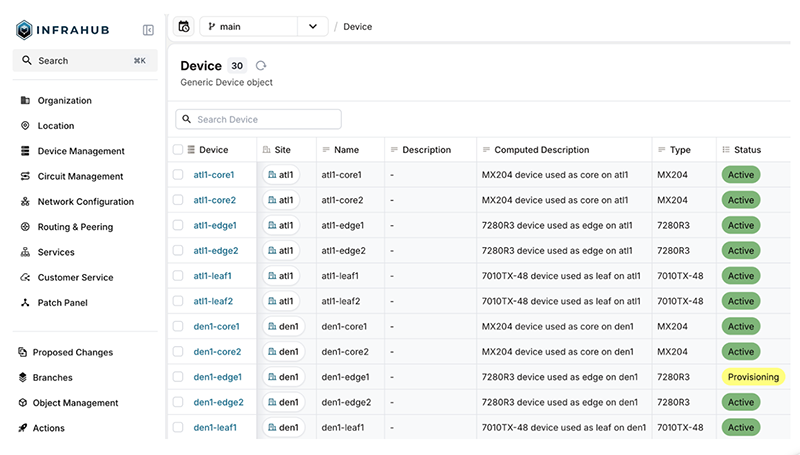
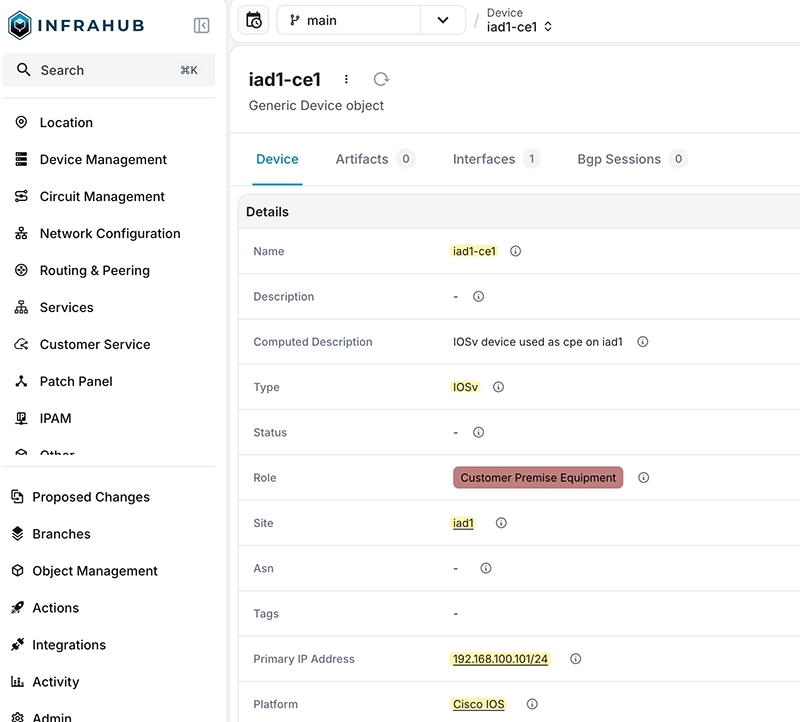
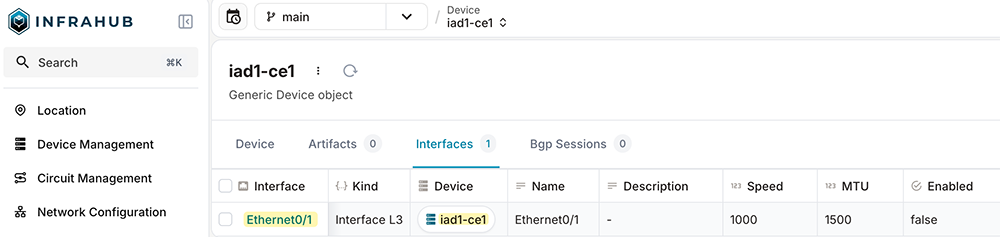
We’ll also add a new device that we’ll use for most of the examples. We’ll create a new IPAM prefix of 192.168.100.0/24, a site called iad1, and a device named iad1-ce1. The device will have a single interface (Ethernet0/1), and an IP address of 192.168.100.101 assigned to the device.
The GitHub repository includes a helper script at infrahub/import_lab_devices.py that can create these objects for you. In this post, we’ll create them manually so we can use our own IP address and interface name.
Installing Ansible collections in Infrahub
Next, we’ll install the required Ansible collections, with the key one being opsmill.infrahub. This collection allows Ansible to use Infrahub as its inventory source instead of relying on a static host file.
You’ll need to update the secrets file (ansible/vars/secrets.yml) with your Infrahub connection details. This includes setting the Infrahub host, port, and API token so Ansible can authenticate and query inventory from your Infrahub instance.
Note! For the sake of simplicity, we’re using hard-coded credentials and API tokens in this example. In a real environment, you should never store passwords or secrets in plain text files. Always use secure methods to store sensitive information.
Pulling dynamic inventory from Infrahub
The ansible/infrahub_inv.yml file defines how Ansible pulls inventory data from Infrahub. Instead of listing devices in a static inventory file, Ansible queries Infrahub directly using its API and builds the inventory at runtime. Devices, attributes, and relationships are all sourced from the data already stored in Infrahub.
At a high level, this inventory tells Ansible which objects to pull from Infrahub, how to map Infrahub fields to Ansible variables, and how to group devices. In this case, devices are grouped by site and by country, and fields like hostname, management IP, and network OS are derived from the Infrahub data model.
At this point, if you navigate to the ansible directory, you should be able to run ansible-inventory --extra-vars '@vars/secrets.yml' --graph -v and see the inventory rendered. You’ll see the sites created earlier, along with the device we added, listed under the appropriate site and country groups.
@all:

  |--@ungrouped:

  |--@site_atl1:

  |  |--atl1-edge2

  |  |--atl1-leaf1

  |  |--atl1-core1

  |  |--atl1-edge1

  |  |--atl1-core2

  |  |--atl1-leaf2

  |--@country_united_states_of_america:

  |  |--atl1-edge2

  |  |--atl1-leaf1

  |  |--atl1-core1

  |  |--atl1-edge1

  |  |--atl1-core2

  |  |--atl1-leaf2

  |  |--ord1-edge1

  |  |--ord1-edge2

  |  |--ord1-leaf1

  |  |--ord1-core1

  |  |--ord1-core2

  |  |--ord1-leaf2

  |  |--jfk1-edge2

  |  |--jfk1-edge1

  |  |--jfk1-leaf1

  |  |--jfk1-core2

  |  |--jfk1-core1

  |  |--jfk1-leaf2

  |  |--den1-core2

  |  |--den1-leaf2

  |  |--den1-edge2

  |  |--den1-edge1

  |  |--den1-leaf1

  |  |--den1-core1

  |  |--dfw1-leaf1

  |  |--dfw1-core2

  |  |--dfw1-core1

  |  |--dfw1-edge1

  |  |--dfw1-edge2

  |  |--dfw1-leaf2

  |  |--iad1-ce1

  |--@site_ord1:

  |  |--ord1-edge1

  |  |--ord1-edge2

  |  |--ord1-leaf1

  |  |--ord1-core1

  |  |--ord1-core2

  |  |--ord1-leaf2

  |--@site_jfk1:

  |  |--jfk1-edge2

  |  |--jfk1-edge1

  |  |--jfk1-leaf1

  |  |--jfk1-core2

  |  |--jfk1-core1

  |  |--jfk1-leaf2

  |--@site_den1:

  |  |--den1-core2

  |  |--den1-leaf2

  |  |--den1-edge2

  |  |--den1-edge1

  |  |--den1-leaf1

  |  |--den1-core1

  |--@site_dfw1:

  |  |--dfw1-leaf1

  |  |--dfw1-core2

  |  |--dfw1-core1

  |  |--dfw1-edge1

  |  |--dfw1-edge2

  |  |--dfw1-leaf2

  |--@site_iad1:

  |  |--iad1-ce1
To view inventory details for just iad1-ce1, you can use Ansible’s host-specific inventory output. From the ansible directory, you can run ansible-inventory --extra-vars '@vars/secrets.yml' --host iad1-ce1. This will show all inventory data Ansible pulled from Infrahub for that single device, including the variables generated by the dynamic inventory.
{

    "ansible_host": "192.168.100.101",

    "cisco_ssh_pass": "admin",

    "cisco_ssh_user": "admin",

    "hostname": "iad1-ce1",

    "id": "18865467-ea63-addf-365f-c5128edc4fd3",

    "infrahub_host": "10.10.0.43",

    "infrahub_port": 8000,

    "infrahub_token": "06438eb2-8019-4776-878c-0941b1f1d1ec",

    "name": "iad1-ce1",

    "platform": "ios",

    "primary_address": {

        "address": "192.168.100.101/24",

        "id": "18865478-15b5-d78d-3653-c51f66357832"

    },

    "role": "cpe",

    "site": {

        "id": "1886545c-b4c5-fd18-3654-c51566e9f383",

        "name": "iad1",

        "parent": {

            "id": "18865279-64c3-83a8-365b-c51f51ef0d5c",

            "name": "United States of America"

        }

    },

    "tags": null,

    "webhook_shared_secret": "ansible-testing",

    "webhook_token": "ansible-testing"

}
Using the Ansible playbook
Next, let’s look at the Ansible playbook that manages the interface change. At a high level, this playbook connects to the device and updates the administrative state of a single interface. It uses the Cisco IOS collection to apply the change.
---

- name: Change Interface Status on Cisco IOS Device

  hosts: iad1-ce1

  gather_facts: no

  connection: network_cli # Or your preferred connection plugin


  vars:

    ansible_network_os: "{{ platform }}"

    ansible_user: "{{ cisco_ssh_user }}"

    ansible_password: "{{ cisco_ssh_pass }}"


  tasks:

    - name: Change interface {{ interface_name }} admin_up status to {{ admin_up | bool }}

      cisco.ios.ios_interfaces:

        config:

          - name: "{{ interface_name }}"

            enabled: "{{ admin_up | bool }}"

      register: interface_output


    - name: Display Interface Status Change Output

      ansible.builtin.debug:

        var: interface_output
The playbook expects a few variables to be provided at runtime. The most important ones are the interface name and the desired admin state. The interface_name is the interface you want to change, and the admin_up variable controls whether the interface is enabled or disabled. When admin_up is set to true, the interface is enabled. When it’s set to false, the interface is shut down. Device access details and Infrahub-related settings are pulled from the secrets file.
It’s a good idea to run the playbook manually to confirm it works as expected. You can do this by running the playbook directly and passing the required values using --extra-vars, including the interface name and desired admin state. This helps validate the playbook logic on its own before moving forward.
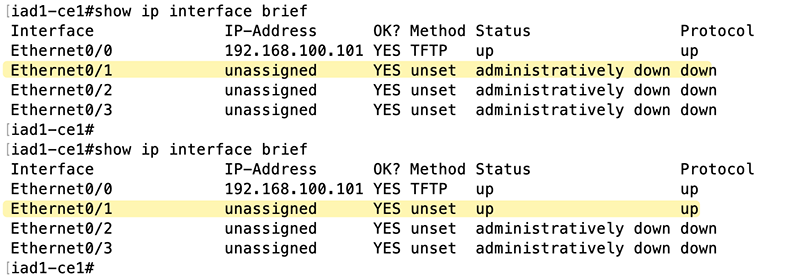
ansible-playbook --extra-vars '@vars/secrets.yml' --extra-vars interface_name='Ethernet0/1' --extra-vars admin_up=true ./cisco_interface_status_change.ymlThe figure below shows the interface state before and after running the playbook with admin_up set to true. You can see that Ethernet0/1 starts in an administratively down state and is brought up successfully once the playbook is executed.
How Ansible implements event-driven automation
Ansible is an open-source framework well known for its ability to execute configuration changes through playbooks. Event-Driven Ansible adds the ability to listen for events and trigger those playbooks automatically.
Note: The EDA acronym is commonly used across the industry to mean event-driven automation and also by Ansible to mean Event-Driven Ansible. In this post, when we refer to EDA, we mean event-driven automation in general, unless we’re explicitly talking about Ansible’s EDA Server.
Ansible’s event-driven capabilities exist through the Ansible EDA Server, which is part of the broader Ansible automation platform. You’d need EDA Server if you were trying to run event-driven automation at enterprise scale, orchestrating thousands of events at a time.
But at the heart of EDA Server is the lightweight Ansible Rulebook application, which is enough for local and small-scale workflows involving a handful of events. Ansible Rulebook is what we’ll use in our example.
Event-Driven Ansible listens for something to happen (an “event”), evaluates it against a set of rules, and then takes an action when those conditions are met. Those rules are defined in an Ansible rulebook and follow a simple if A happens, then do B pattern.
An “event” could be a monitoring alert, a configuration update in a source of truth, or a user editing a device property. Each event can automatically launch a workflow, such as pushing a new configuration or rolling back a failed change.
In our example, the event is a webhook sent from Infrahub when an interface status changes. The rulebook listens for that webhook, checks the payload for the expected values, and then runs the interface change playbook. The playbook receives the interface name and desired state from the event itself and applies the change on the device. This allows a change made in Infrahub to automatically trigger the correct action in Ansible without manual intervention.
Working with the Ansible rulebook
An Ansible rulebook defines how Ansible listens for events and what actions to take when those events occur. It ties together an event source, the conditions to evaluate, and the automation that should run when those conditions are met.
---

- name: Respond to Interface Status Change Webhook

  hosts: all

  sources:

    - ansible.eda.webhook:

        host: 0.0.0.0

        port: 5001

        endpoint: "/webhooks"


  rules:

    - name: Change Interface Admin Status based on webhook

      condition: event.payload.data.changelog.attributes.enabled.value_update_status == "updated"

      action:

        run_playbook:

          name: cisco_interface_status_change.yml

          extra_vars:

            interface_name: "{{ event.payload.data.changelog.display_label }}"

            admin_up: "{{ event.payload.data.changelog.attributes.enabled.value }}"

            infrahub_token: "{{ infrahub_token }}"

            cisco_ssh_user: "{{ cisco_ssh_user }}"

            cisco_ssh_pass: "{{ cisco_ssh_pass }}"
In this example, the rulebook listens for incoming webhooks from Infrahub. When a webhook arrives, it checks whether the interface-enabled state was updated. If that condition matches, the rulebook runs the interface change playbook and passes in the interface name and desired admin state from the webhook payload. This is the piece that connects a change made in Infrahub to an actual configuration change on the device.
To run the rulebook, we use the ansible-rulebook command and point it at the rulebook file, the Infrahub inventory, and the secrets file. When this command is run, Ansible launches the rulebook and begins listening for incoming webhook events on the configured address and port.
ansible-rulebook -r ./webinar_rulebook.yml -i ./infrahub_inv.yml -e ./vars/secrets.yml -vSetting up the Infrahub webhook
A webhook is a way for Infrahub to send structured data to external systems based on defined events. Infrahub delivers an HTTP request to a configured endpoint with details about the event, allowing other tools to act on that information.
Infrahub supports two different types of webhooks. We’ll cover standard webhooks in this example.
Standard Webhooksends event information to an external endpoint.Custom Webhookallows the ability to tie events to a transformation to configure the payload being sent to an external endpoint.
The Git repository includes a helper script that creates the webhook needed for this example, located at infrahub/create_webhook.py. This script defines a standard Infrahub webhook that points to the Ansible rulebook listener. 10.10.0.180 is the IP address of the host that runs the Ansible rulebook.
webhook_data = {

  "name": "Cisco Interface Status Change",

  "description": "Webhook for Cisco Interface Status Change",

  "url": "http://10.10.0.180:5001/webhooks",

  "event": "infrahub.node.updated",

  "node_kind": "InfraInterfaceL3",

  "validate_certificates": False,

  "branch_scope": "default_branch",

}
python3 create_webhook.py
Webhook created successfully.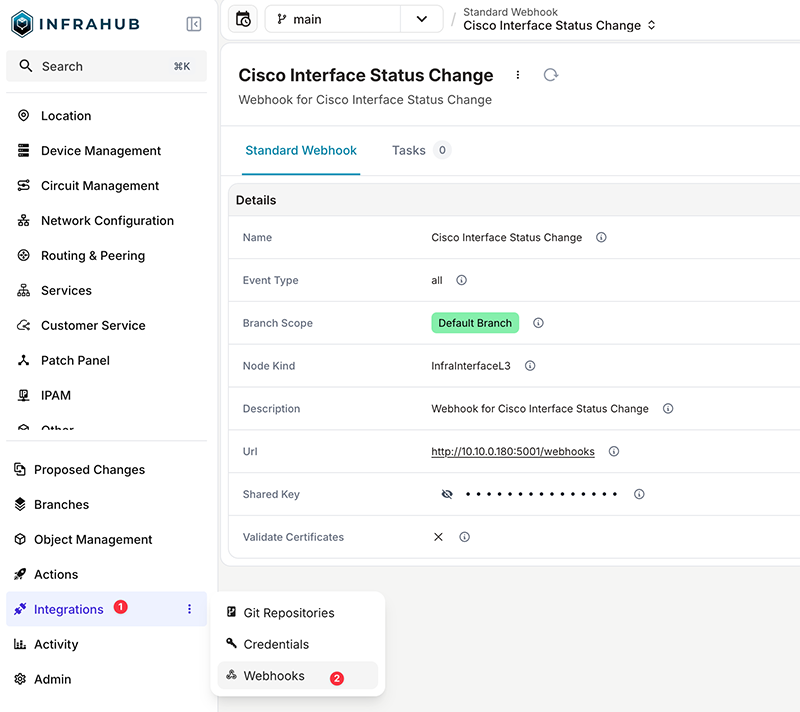
The webhook is configured to trigger on node update events and is scoped specifically to InfraInterfaceL3 node. This means Infrahub will send a webhook whenever an interface object is updated, which is exactly what we need to detect interface admin state changes and pass that information to Ansible.
The webhook URL points to the system where the Ansible rulebook is running. In this case, Infrahub sends the event data to the rulebook listener on that address and path so Ansible can receive the event and take action.
Testing our event-driven automation workflow
At this point, everything is in place, and we’re ready to test. From the Infrahub UI, navigate to the device iad1-ce1, select the interface we created earlier, and toggle the Enabled checkbox. Saving that change triggers the standard webhook configured earlier.
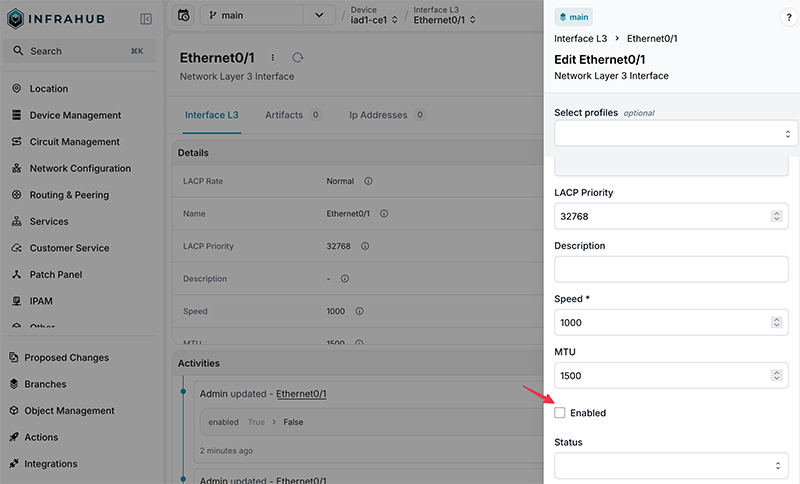
Infrahub sends the event to the host running the Ansible rulebook. The rulebook receives the payload, matches the condition, and runs the interface playbook with the interface name and enabled value from the event, which results in the interface being shut down or enabled on the device based on the requested state.
In the rulebook output, you can see the incoming webhook payload, including the interface name and the enabled status that Infrahub sent.
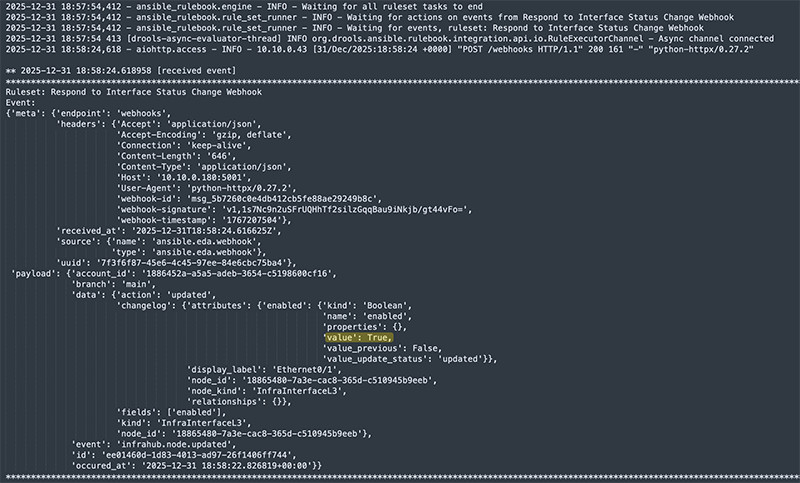
You can run the rulebook in verbose mode using ansible-rulebook -r ./webinar_rulebook.yml -i ./infrahub_inv.yml -e ./vars/secrets.yml -vvv. This makes it easier to see the full webhook payload that Infrahub sends and how the rulebook processes the event.
Building on the event-driven automation pattern
In this post, we walked through a simple end-to-end example of event-driven automation using Infrahub and Ansible. We used Infrahub to model data and drive events, and Ansible to react to those events and apply configuration changes on a device.
The key takeaway is the pattern itself. Changes are made in one place, Infrahub emits an event, and automation reacts in a consistent and repeatable way.
From here, the same approach can be extended to other device types, workflows, and automation tasks as your environment grows.