 Announcing Infrahub 1.0!!
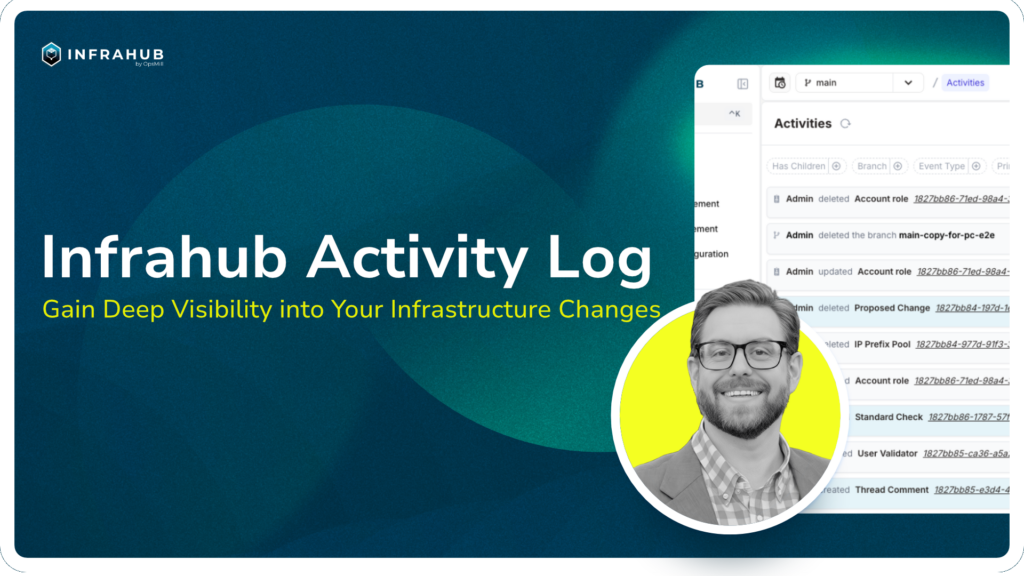
Understanding the history of changes within your infrastructure is crucial for maintaining stability, troubleshooting issues, and ensuring compliance. We’re excited to introduce the Activity Log, a comprehensive feature that provides deep visibility into all actions and events occurring within your infrastructure environment, ensuring you are always well-informed and secure.
The Activity Log meticulously documents every change within the system, allowing you to track objects that have changed, precisely when the change occurred, and the user or system responsible. This detailed record empowers you to:
- Troubleshoot Unforeseen Changes: Quickly identify the root cause of unexpected behavior by reviewing the sequence of recent events.
- Conduct Audits: Maintain a clear history of operations for compliance and security purposes.
- Comprehend Update Order: Understand the flow of updates across different parts of your infrastructure.
Centralized Tracking of Infrastructure Events
The Activity Log consolidates and organizes events from various branches and objects into a unified timeline, offering different perspectives to suit your needs:
- Global View: This comprehensive list presents all activities (events) across all branches in a single, chronological feed.
- Object-Level View: This is a focused timeline specific to a single infrastructure object, displaying only the events directly relevant to that object.
- Filtering Capabilities: Our powerful filtering options allow you to narrow your search based on various criteria, including branch, event type, initiating account, primary affected node, related nodes, and a specific date range. This flexibility puts you in control, making your search efficient and effective.
- Nested/Child Events: The Activity Log intelligently tracks and displays cascade actions, where a single top-level event triggers subsequent child events, providing a complete picture of complex operations.
Accessing the Activity Log
Accessing the Activity Log is a breeze. You can conveniently do so via the Global or Object-Level Activity Log pages in Infrahub. Regardless of how you access it, the timestamps display based on your web browser’s local time settings, putting you in control of your viewing experience.
The Activity/Event framework is a key component of the Activity Log, providing a structured way to view and understand the sequence of events. It also has a concept of hierarchy, and Activities that have triggered subsequent child Activities are easily identifiable by a distinct (blue) icon at the end of the log entry.
Global Activity Log
- Menu Location: Navigate to Activity → Activity log.
- Direct URL: Access it directly via `https://<your-instance>/activities`.

Object-Level Activity Log
When you view any infrastructure object (e.g., an IP address or a server) in detail, you will find either a dedicated “Activity logs” panel on the right-hand side or a separate “Activity” tab.

Refining Your View with Filters and Search
The global Activity Log provides a robust set of filters to help you pinpoint the information you need:
- Branch: Select a specific branch (e.g., `main`) to view Activities within that context.
- Event Type: Filter by categories of actions, such as `Node Created` or `Branch Deleted`. For a comprehensive list of event types, refer to the Infrahub Events documentation.
- Account / User: Display only events initiated by a particular user account.
- Primary / Related Node: Highlight activities associated with a specific infrastructure object.
- Has Children: Filter will show only Activities that triggered subsequent child Activities.
- Date Range: Define a specific start, end, and time to focus on Activities within that period.

Activity Log filtered by Primary Node.

Activity Log filtered by Children
Delving into Event Details
For a deeper understanding of any specific event, select “View more” from either the global or object-level Activity Log. Clicking on View More will open a detailed view, either on a separate page or as a popover, providing additional crucial information:
- Event ID: A unique identifier (UUID) for the specific event.
- Event Type: The technical type of the event (e.g., `infrahub.node.updated`). Consult the Infrahub Events documentation for more details.
- Occurred At: The precise timestamp of when the event took place.
- Account: The user account that initiated the activity.
- Primary Node: The main infrastructure object affected by the event.
- Related Nodes: Any other infrastructure objects also impacted by the event.
- Changes: A detailed view of the changed attributes, including the “before” and “after” values for update events.

Activity details page with children

Activity log details.
Next Steps
The introduction of the Activity Log provides an invaluable tool for gaining comprehensive insight into the changes occurring within your infrastructure. By leveraging this feature, you can enhance your ability to troubleshoot, audit, and understand the dynamics of your infrastructure environment. Start exploring the Activity Log today and unlock a new level of visibility!
![65a656b0aa32b71080018ef5_logoOpsmill[1]](https://www.opsmill.com/wp-content/uploads/2024/07/65a656b0aa32b71080018ef5_logoOpsmill1.svg "65a656b0aa32b71080018ef5_logoOpsmill[1]")